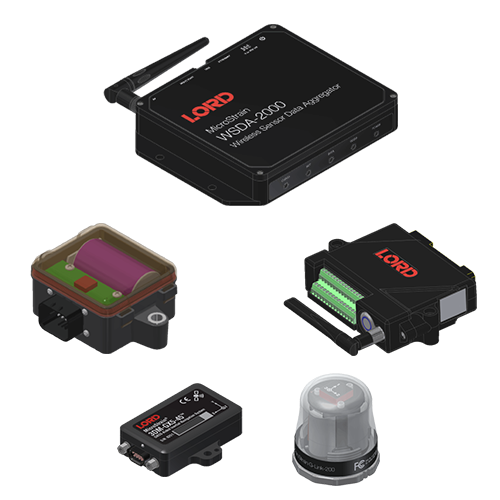
WSDA-2000
LORD Sensing's WSDA-2000 pushes data directly to SensorCloud. Simply add the WSDA-2000 to your SensorCloud account, and any sensor data collected will be uploaded automatically.
Already have an account? Log In!
LORD Sensing's WSDA-2000 pushes data directly to SensorCloud. Simply add the WSDA-2000 to your SensorCloud account, and any sensor data collected will be uploaded automatically.
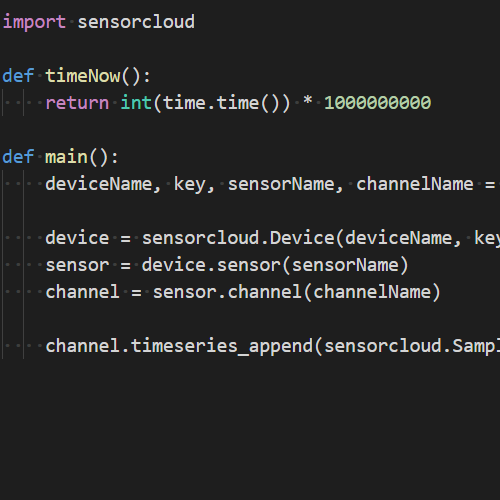
Upload your own data using SensorCloud's RESTful Web API. Example Code is provided in Python, Java, C#, and LabVIEW.
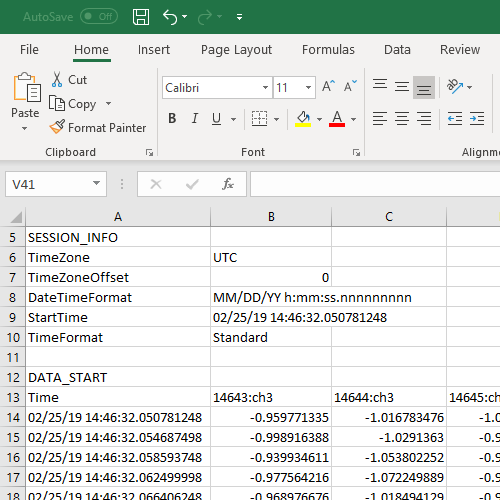
Have some data already in CSV format? Our drag and drop CSV uploader makes it easy to import into SensorCloud.
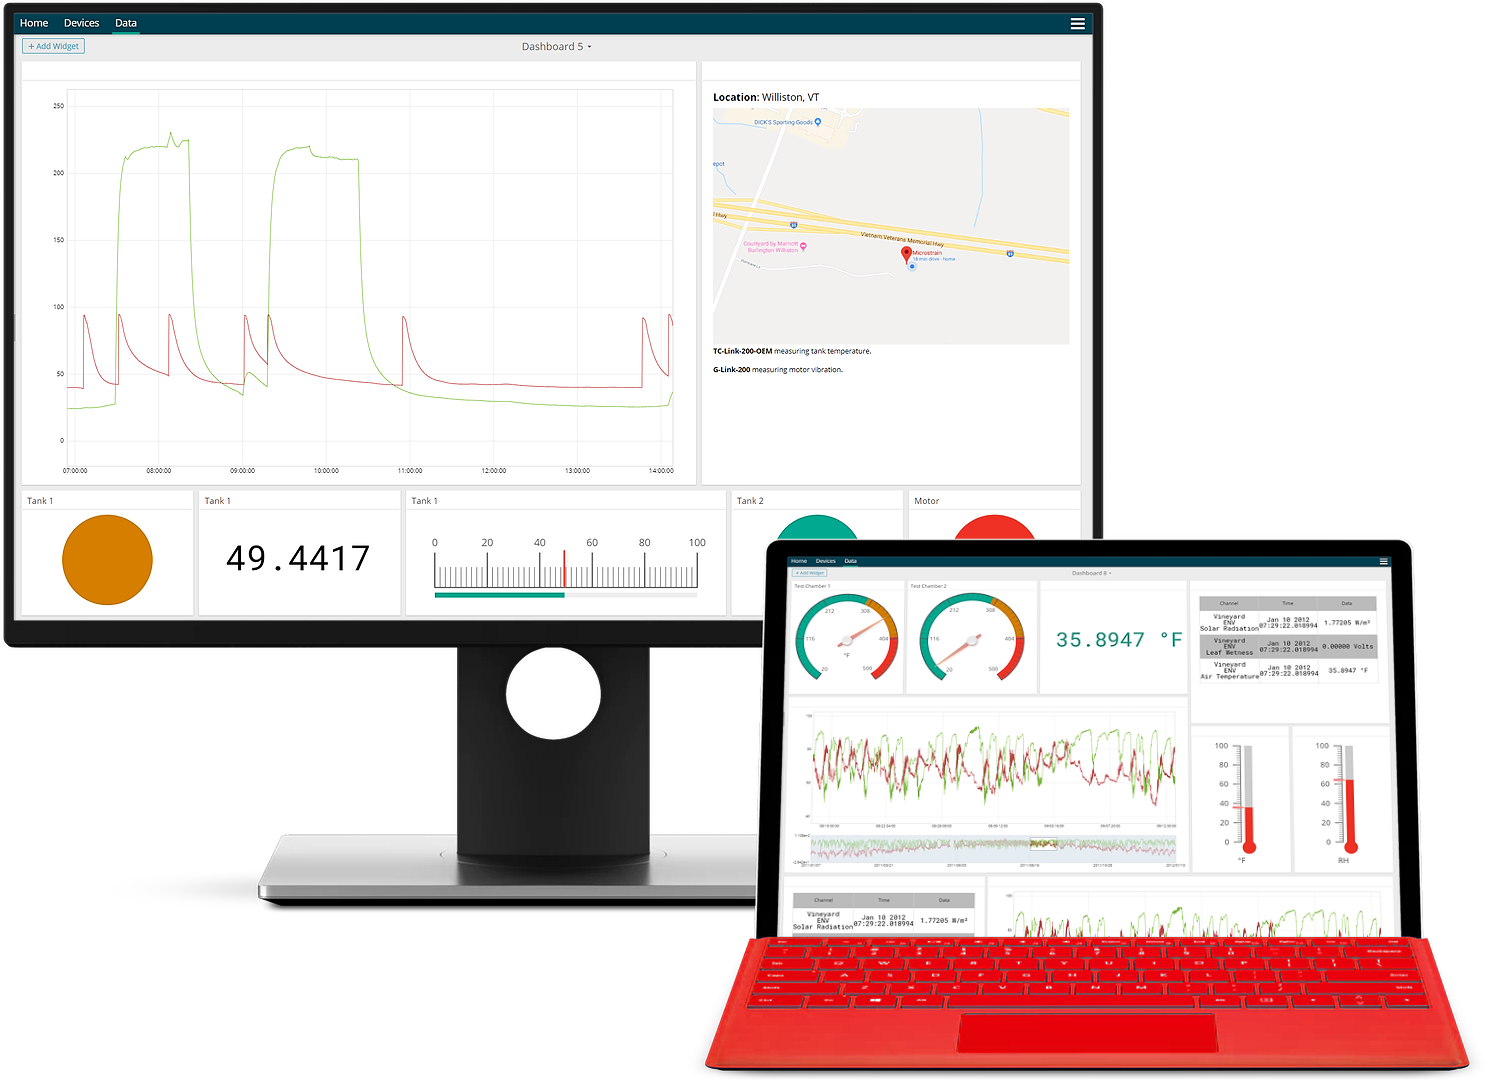
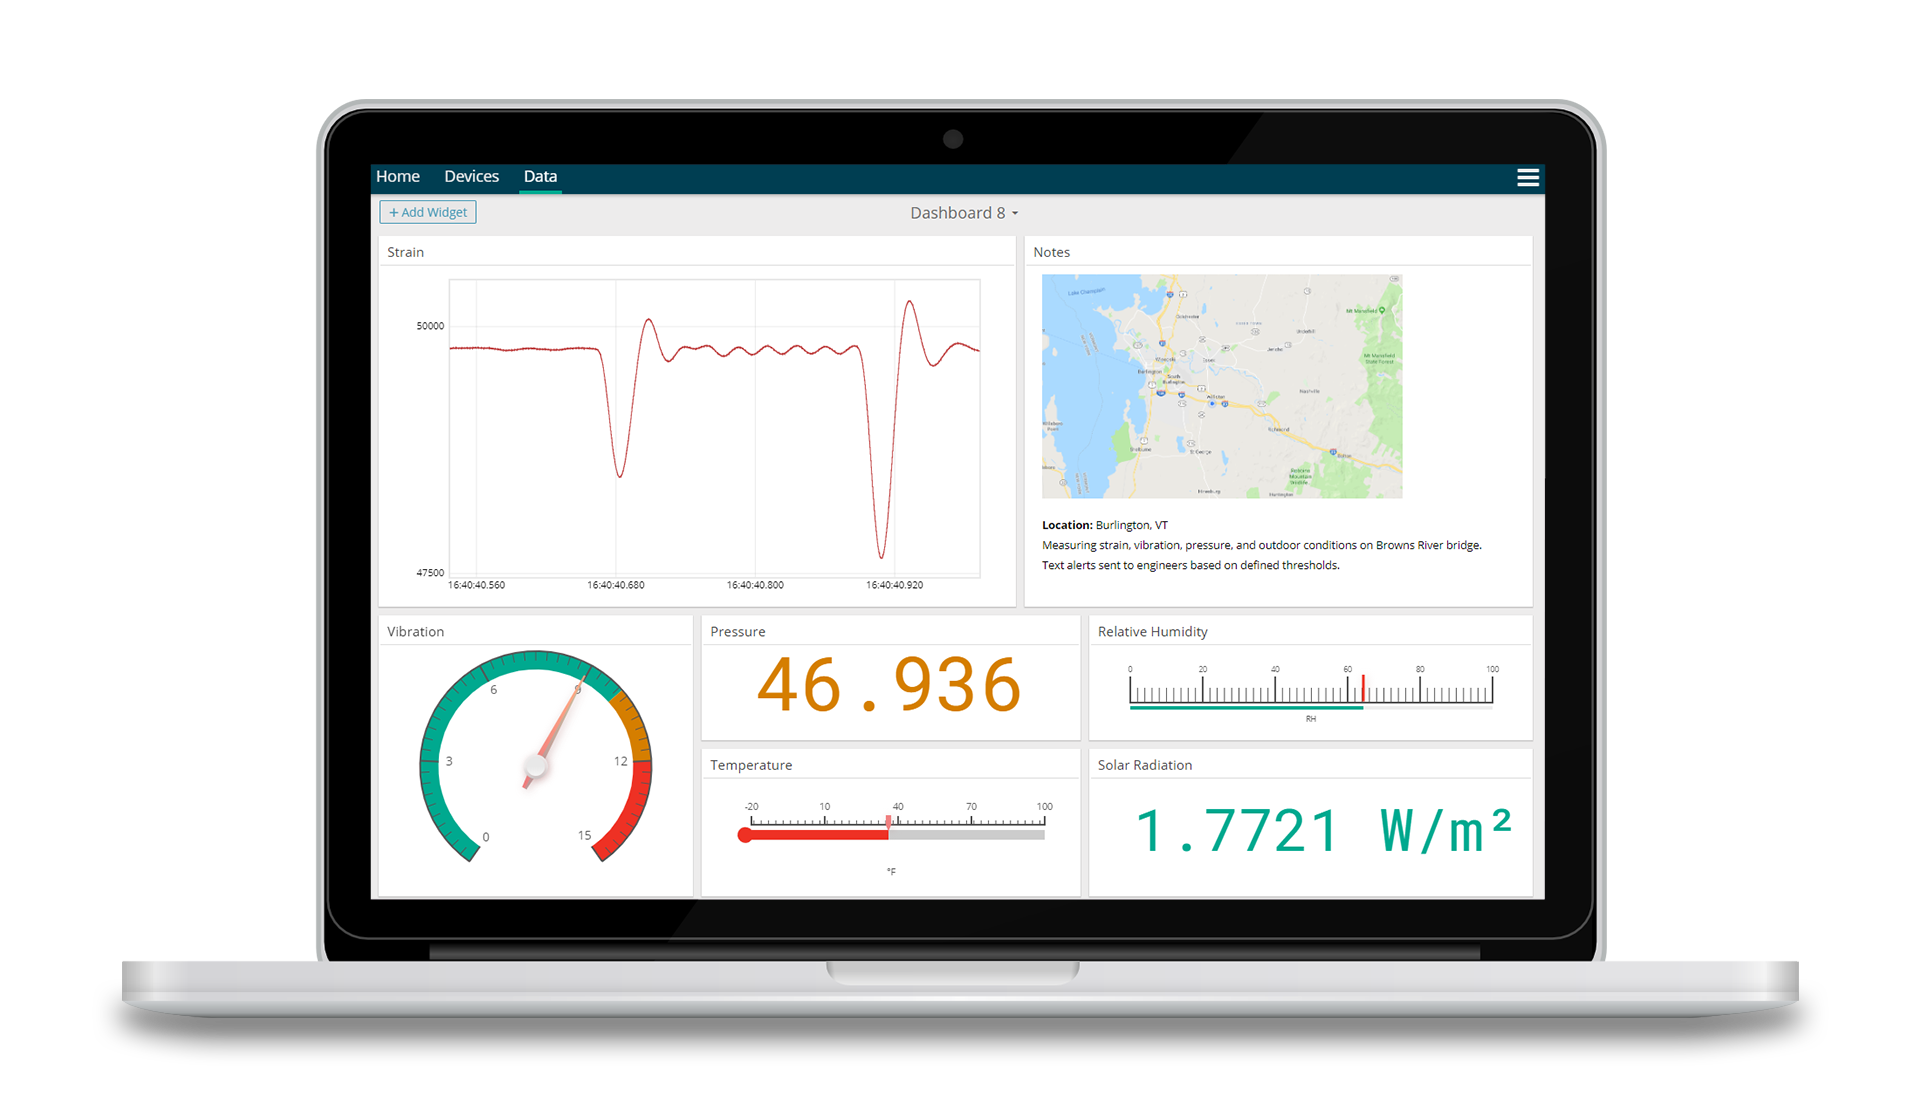
Create beautiful dashboards with a variety of Data Widgets, including timeseries graphs, radial gauges, text charts, notes, and more. Each widget is fully customizable with settings such as color ranges and precision.
SensorCloud's Timeseries Data Widget was built from the ground up with speed and data in mind. Our unique algorithms allow you quickly view your data, no matter how large. No other visualization software comes close.
Familiar with LORD's desktop software, SensorConnect? You'll feel right at home with SensorCloud. We develop the two together, so you can have a consistent tool no matter the situation. You can even log in to your SensorCloud account from within SensorConnect, and view your local and cloud data in the same Dashboard!
While SensorCloud's dashboards are powerful, we know it's important to be notified of events occuring in your data, even on the weekend.
Customizable alerts allow you to rest easy, and stay informed on your data 24/7.
Choose notifications based on thresholds, or if no data has been collected for a specified amount of time.
Alerts can be received via email and SMS, and can be configured to include event details, such as timestamp and data values.

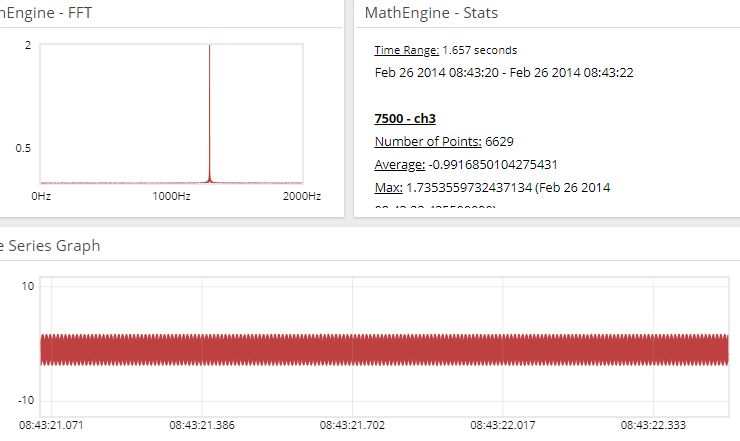
MathEngine allows you to perform common math operations on your datasets.
Simply zoom in to the data of interest on your Timeseries graph, press the MathEngine button, and select the operation you wish to perform. Easily create a fully interactive FFT, or get statistics such as number of points, average, max, min, peak-to-peak, RMS, and standard deviation.
MathEngine operations can be performed on multiple channels of data at the same time. All results are included in one output, so you can easily compare data, and spot differences.
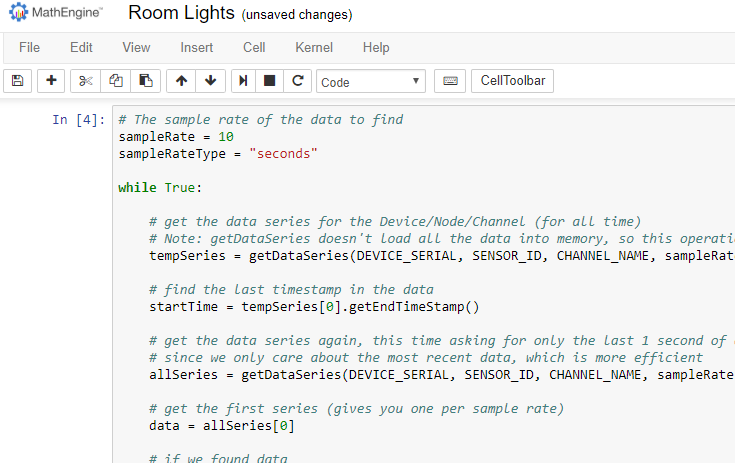
MathEngine Notebooks give you the ability to write your own scripts within SensorCloud.
Analyze your SensorCloud data in any way imaginable by combining it with the power of Python and Jupyter Notebooks. The powerful Scipy and Numpy libraries are available to perform complex mathematics, process digital signals, and generate statistical data. Matplotlib can also be used to to create a wide range of 2d and 3d plots to visualize your data in meaningful ways.
MathEngine Notebooks can be configured to run on a schedule, giving you the power to automate math operations. Feed this data back into a new channel in SensorCloud, and you can visualize it alongside your other data in the standard dashboard.