MathEngine®
Unlock the Power of Your Data

MathEngine gives you the tools to get the information you need from your data. With many ways to process, analyze, and monitor your data, as well as a team that will work with you and your needs, MathEngine will take you beyond data collection to an intelligent data solution.
MathEngine Functions
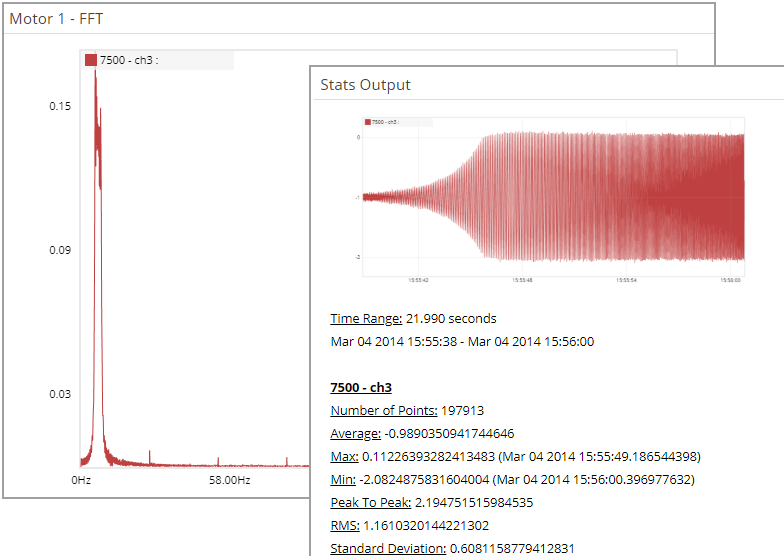
MathEngine functions include generating an FFT, as well as Stats on your datasets. The stats output includes the total number of points, average, min, max, peak-to-peak, RMS, and standard deviation. Both the FFT and Stats functions can be run on multiple channels of data at the same time, allowing you to easily compare differences between channels.
These functions are available directly from the Timeseries data widget. Simply enable the channels of interest, zoom in to the time range that you want to run the analysis on, and press the MathEngine button. A new widget will be created with your results.
MathEngine standard functions are included for free with your SensorCloud account.
MathEngine Notebooks
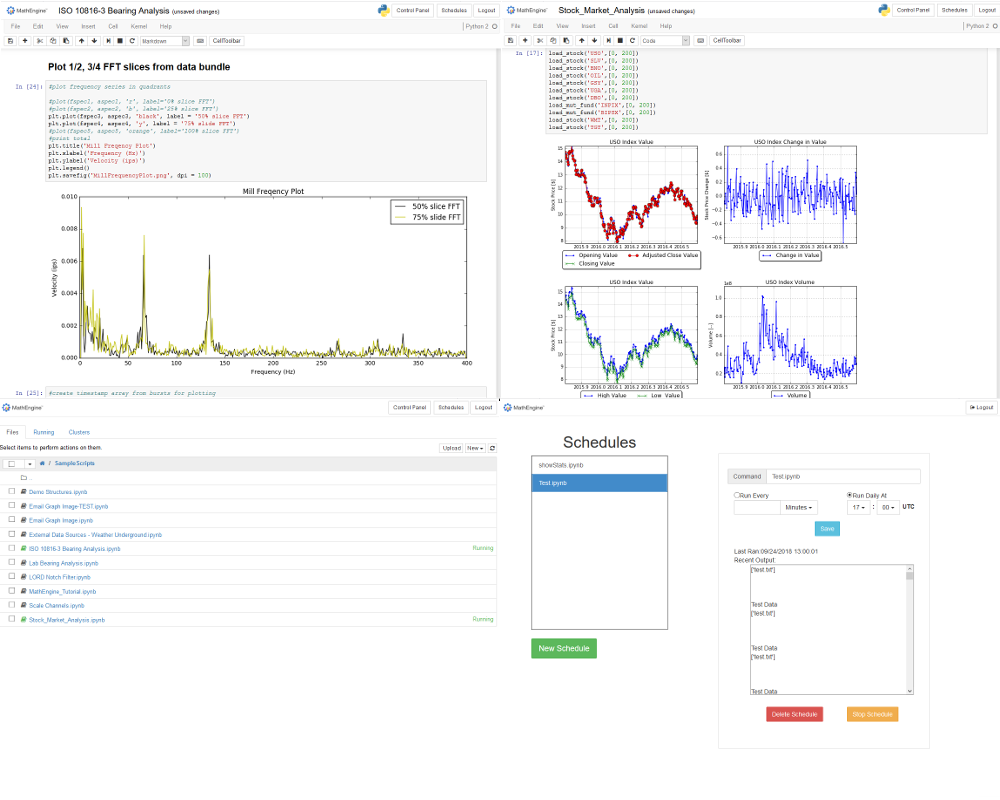
MathEngine also integrates Jupyter Notebooks into its cloud service. These Notebooks allow you to write custom Python scripts to process your data, all on the Cloud. By adding titles and text between code blocks, you can create a full report that can easily be downloaded and shared.
The powerful Scipy and Numpy libraries are available to perform complex mathematics, process digital signals, and generate statistical data. In addition, Matplotlib allows you to create a wide range of 2d and 3d plots to visualize your data in a meaningful way.
MathEngine Notebooks can also be configured to run on a schedule, giving you the power to automate math operations. Feed this data back into a new channel in SensorCloud, and you can visualize it alongside your other data in the standard dashboard.
MathEngine Notebooks are available for $50 /month, for your entire SensorCloud account.
To add MathEngine Notebooks to your account, Log In, go to your Billing settings, and enable the MathEngine Notebooks feature.
Example MathEngine Notebook:
Pull your data down from the Cloud
import MathEngine
from matplotlib.pyplot import plot

deviceSerial = 'YourDeviceSerial'
inSensor     = 'sensor1'
inChannel    = 'channel1'

repo = TimeSeriesRepo(deviceSerial)

inSeries = repo.getAllTimeSeries( inSensor, inChannel, startTime = 1378334486189250000 )[0]
data = inSeries.getData()
print len(data), 'Points'

# Slice out the points you want to look at
data = data[:60000]
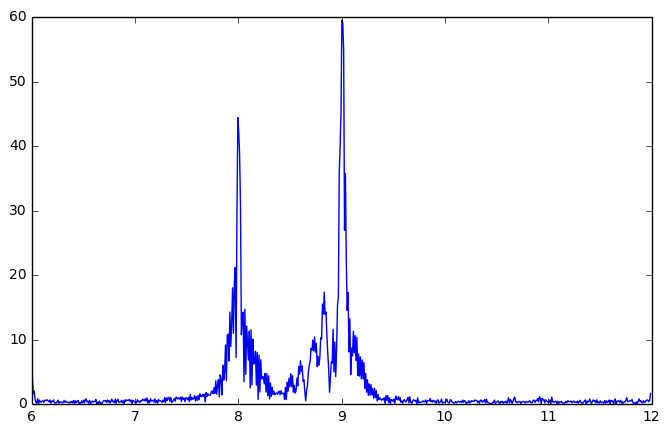
Generate an FFT plot
Find the value at specific frequencies
fft, freq = MathEngine.FFT(data, inSeries.getSampleRate(), xMin=6, xMax=12)
plot(freq, fft)
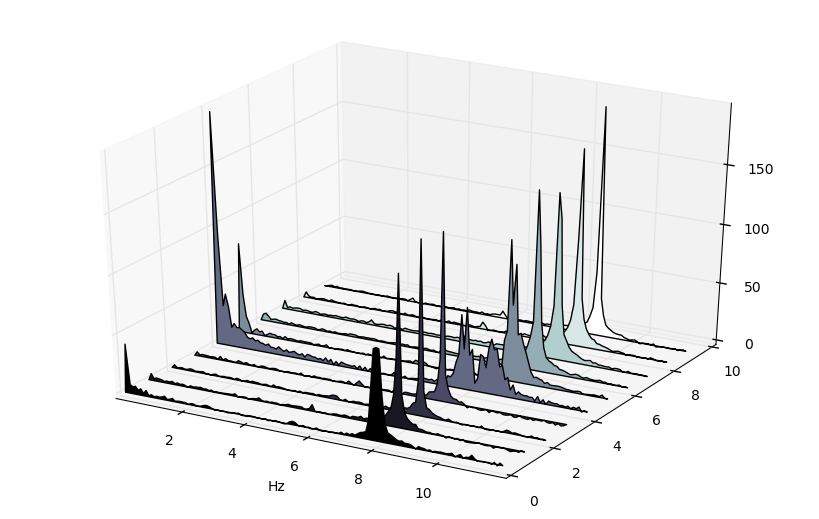
Generate a Waterfall FFT plot
Watch frequency values change over time
fig = plt.figure()

MathEngine.waterfallFFT(fig, data[:60000], inSeries.getSampleRate(), segments=10, xMax=12)